Expository Blog For Qlik Sense
Introduction
Qlik Sense is a self-service Business Intelligence (BI) tool that can be used for creating interactive data visualizations with ease. It has two main tools:-
- Storytelling - Create a story using the app. This is similar to the ppt which we use in our day-to-day life. You can also add pictures, objects, texts in your presentation.
- Sheets - Sheets is a feature which is used to analyze and visualize your data using charts
Installation and Configuration
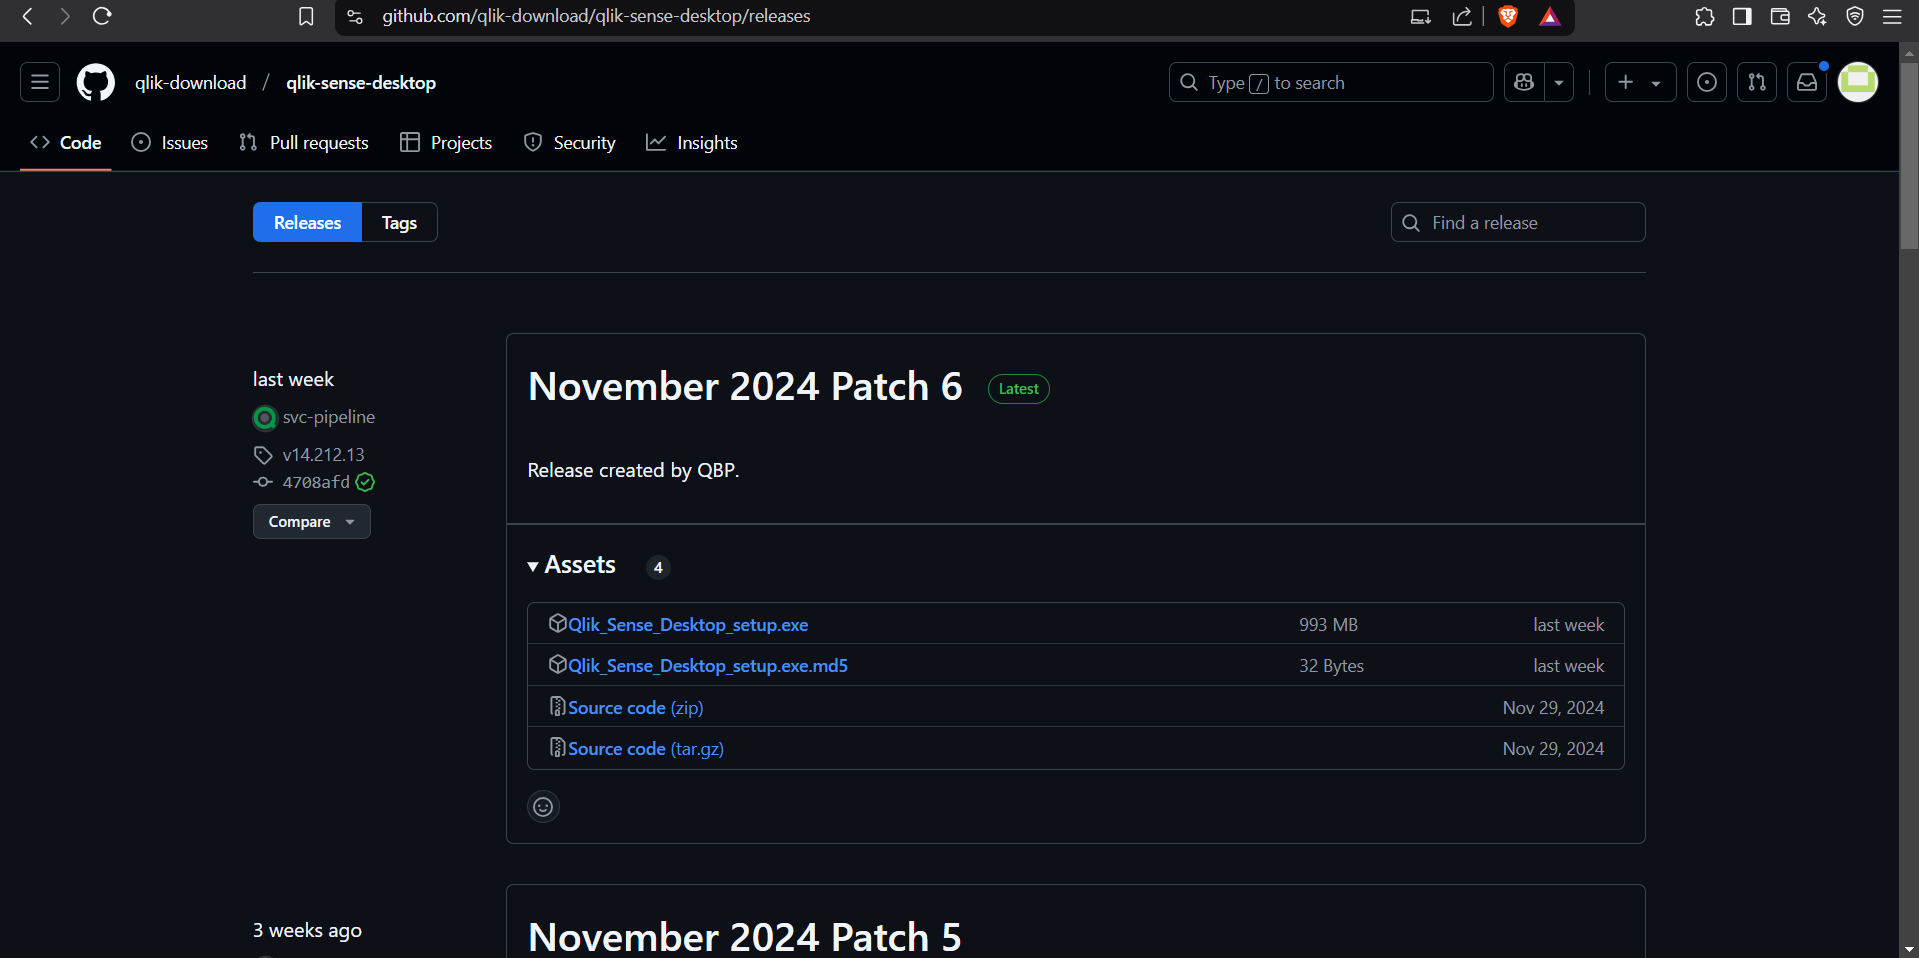
- Go to the given GitHub page and download the setup.exe for the latest patch
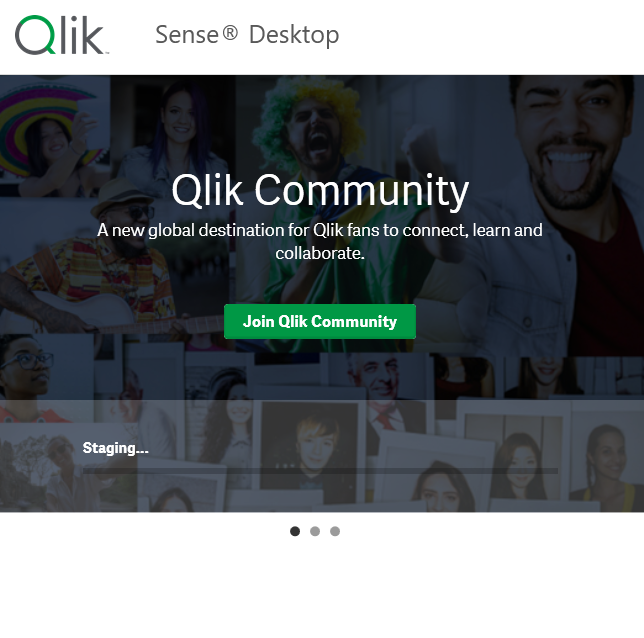
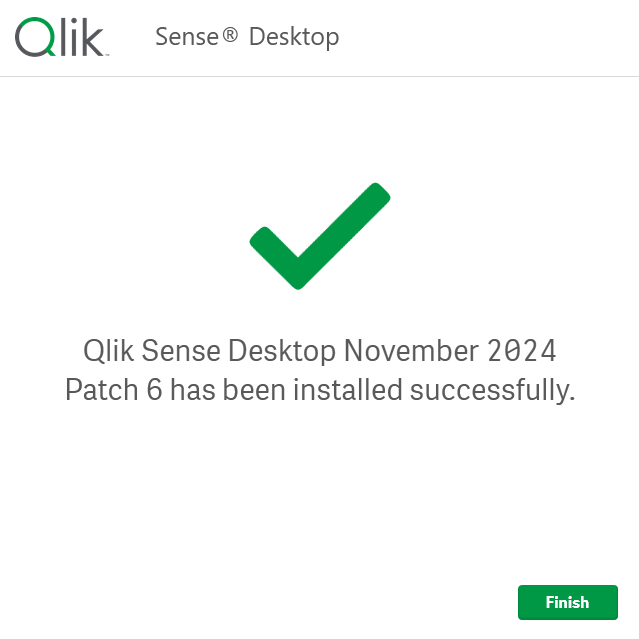
- Start the installation with the default presets
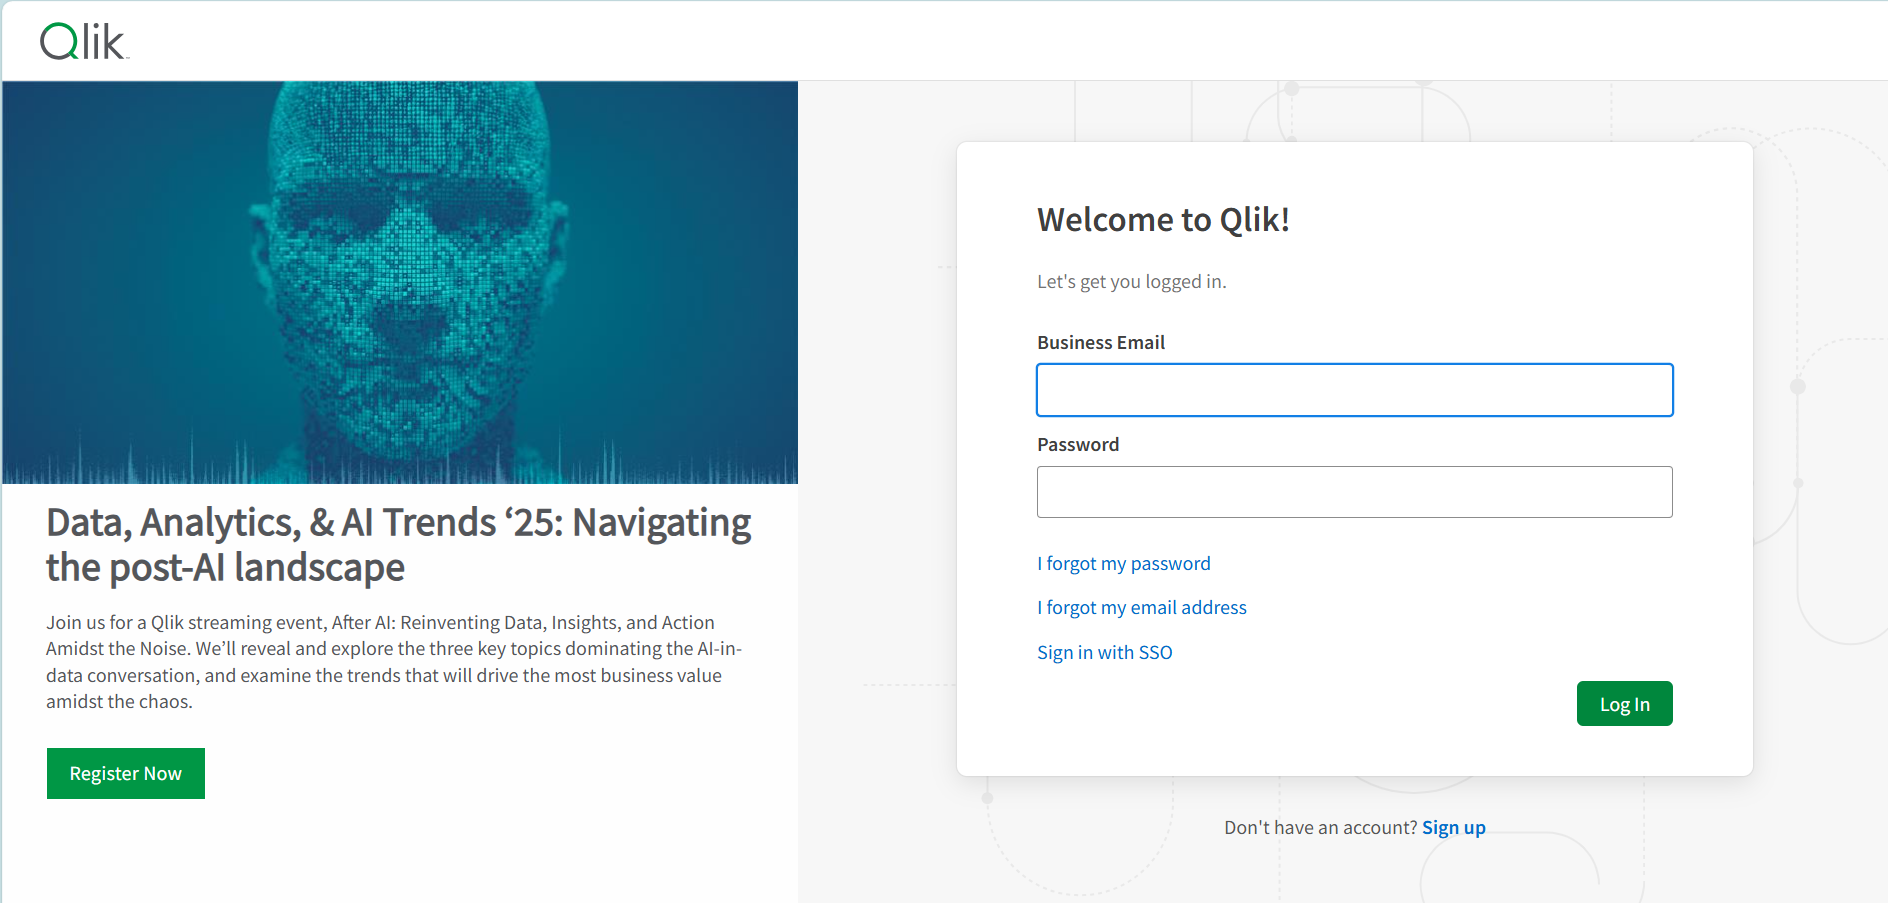
- Now go to Qlik Community Downloads and register for a new account or log in with an existing one
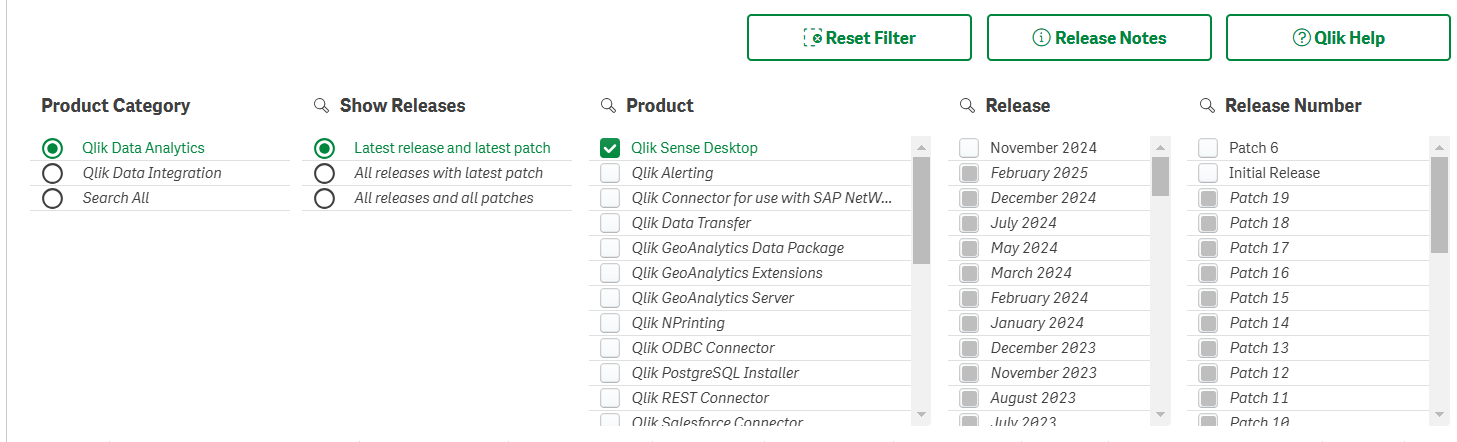
- Select “Product Category” : “Qlik Data Analytics” “Show Releases” : “Latest release and latest patch” “Product” : “Qlik Sense Desktop”, and select the correct “Release” and “Release Number” for your installation.
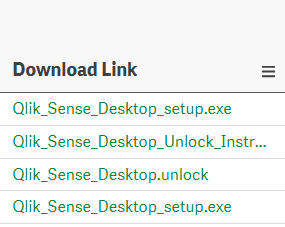
- Scroll down and select and download the link with the name Qlik_Sense_Desktop.unlock
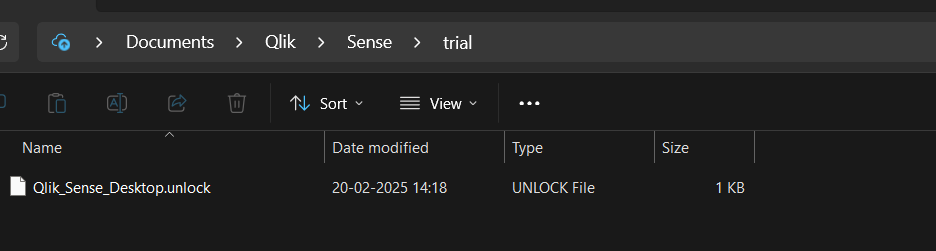
- Go in C:/Documents/Qlik/Sense and create a folder with the name trial (if it is not already present) and cut and paste the file downloaded in the previous step into it.
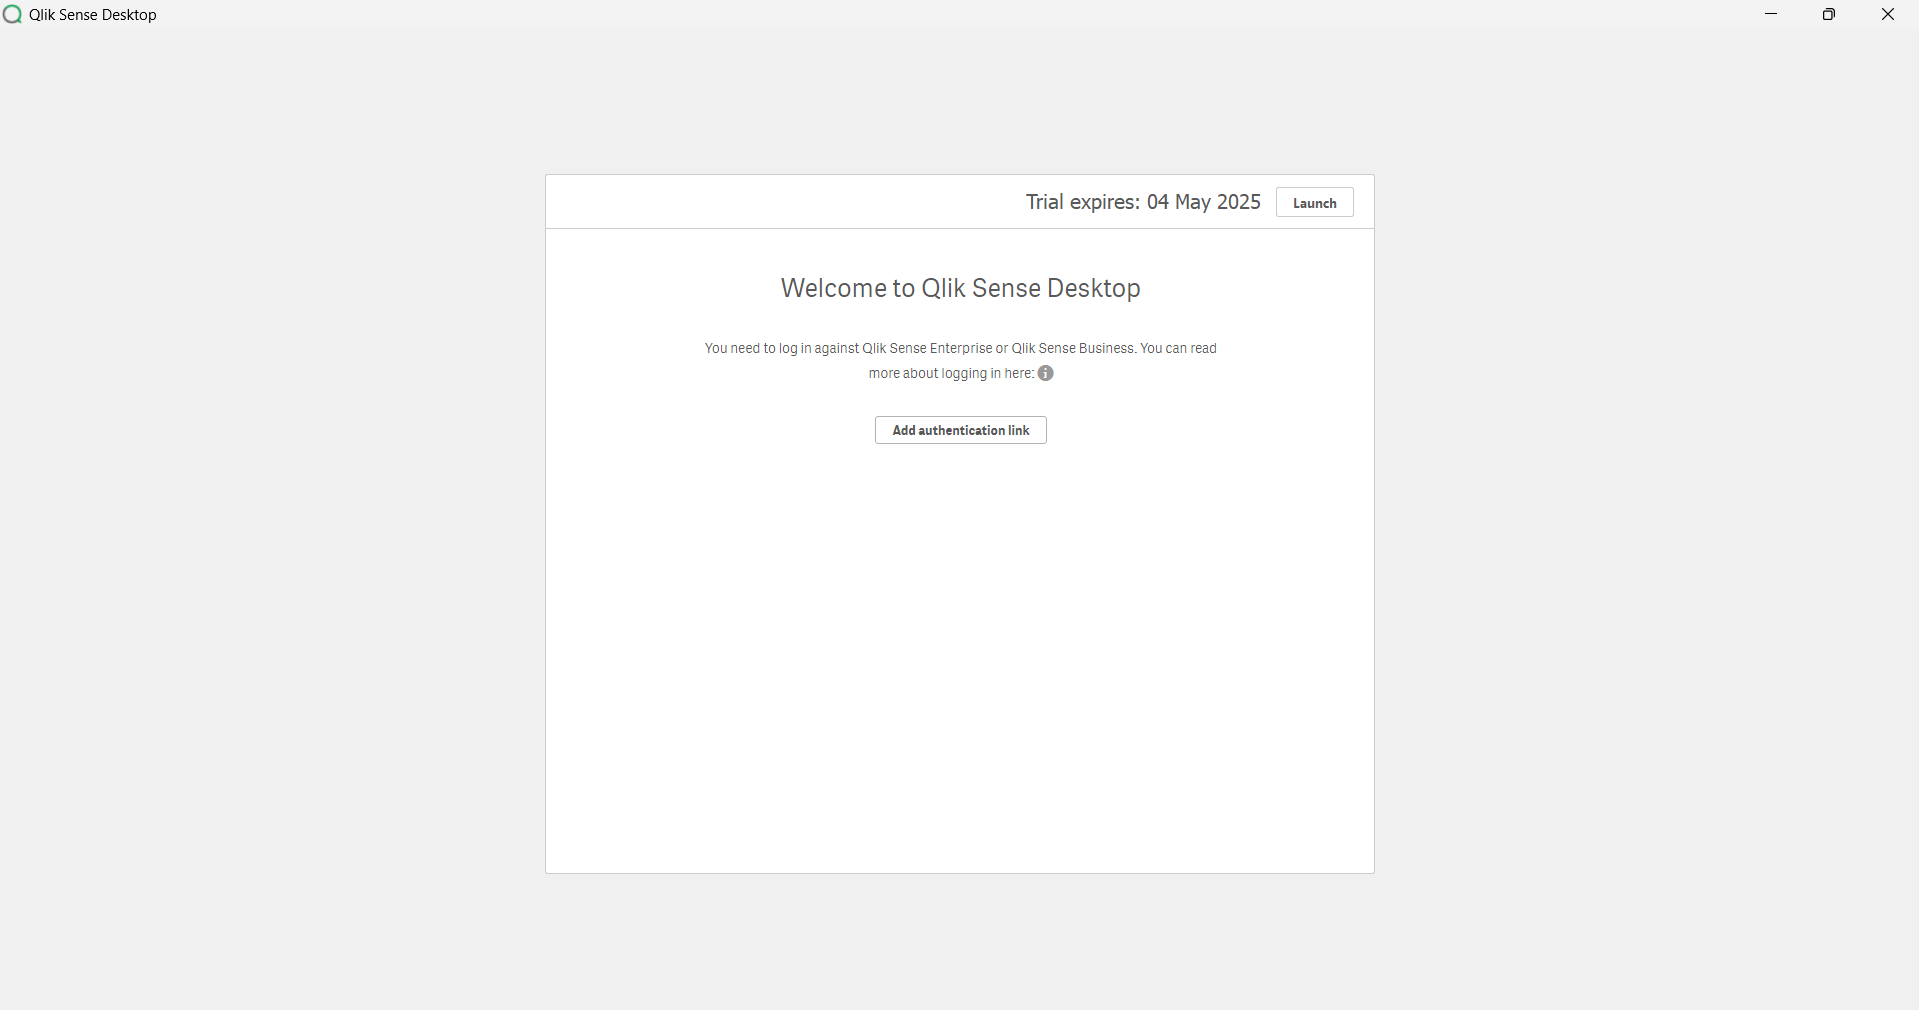
- Now run Qlik Sense Desktop and click the Launch button besides Trial: [DD Month YYYY] to start using the app.
Key Features
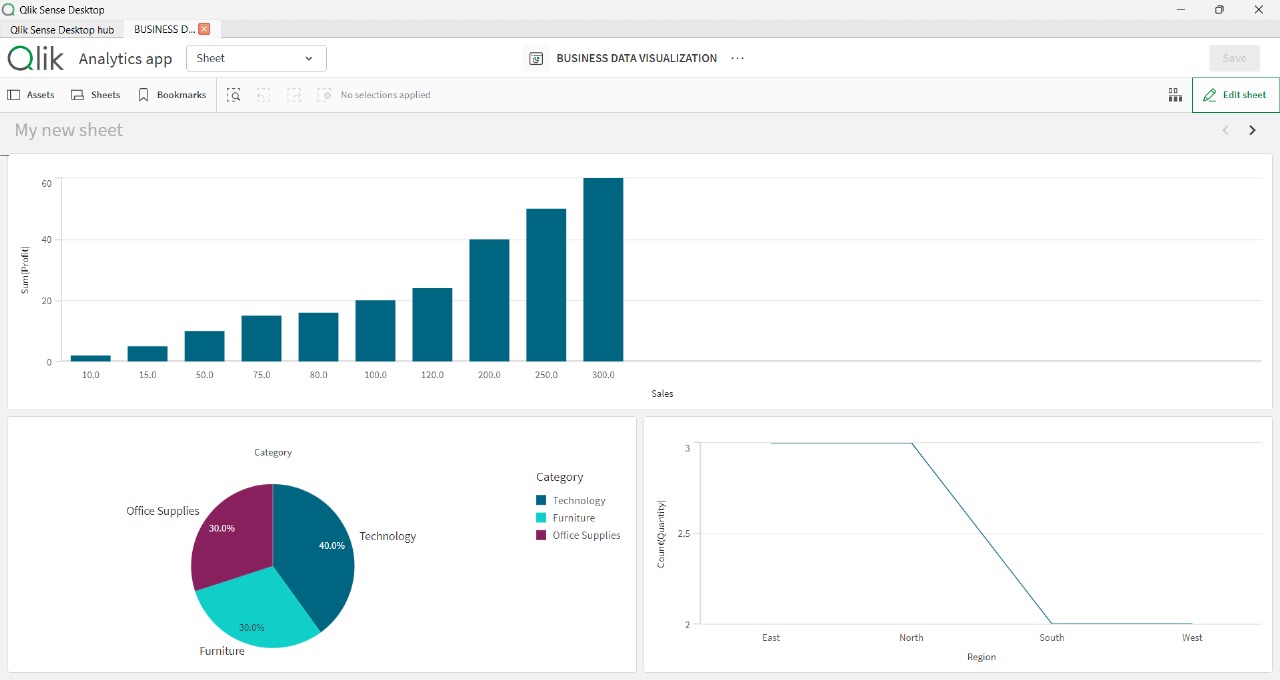
- No need for complex coding or queries, just drag and drop your file.
- Easily create different visualizations (next image) without any hassle.
- AI does the heavy lifting by providing automated insights. You can ask questions in simple English, and it will understand, generate the right chart or dashboard, and even suggest the best visualizations.
- It also offers automated data storytelling and real-time alerts. For example, if sales suddenly drop, a red alert notifies you immediately.
- Files can be uploaded from multiple sources like Excel, SQL, and cloud platforms, and data is merged quickly for smooth analysis.
- With AI handling these tasks, the process becomes effortless, saving you time while keeping everything user-friendly.
Usage Example
Using it to create a story
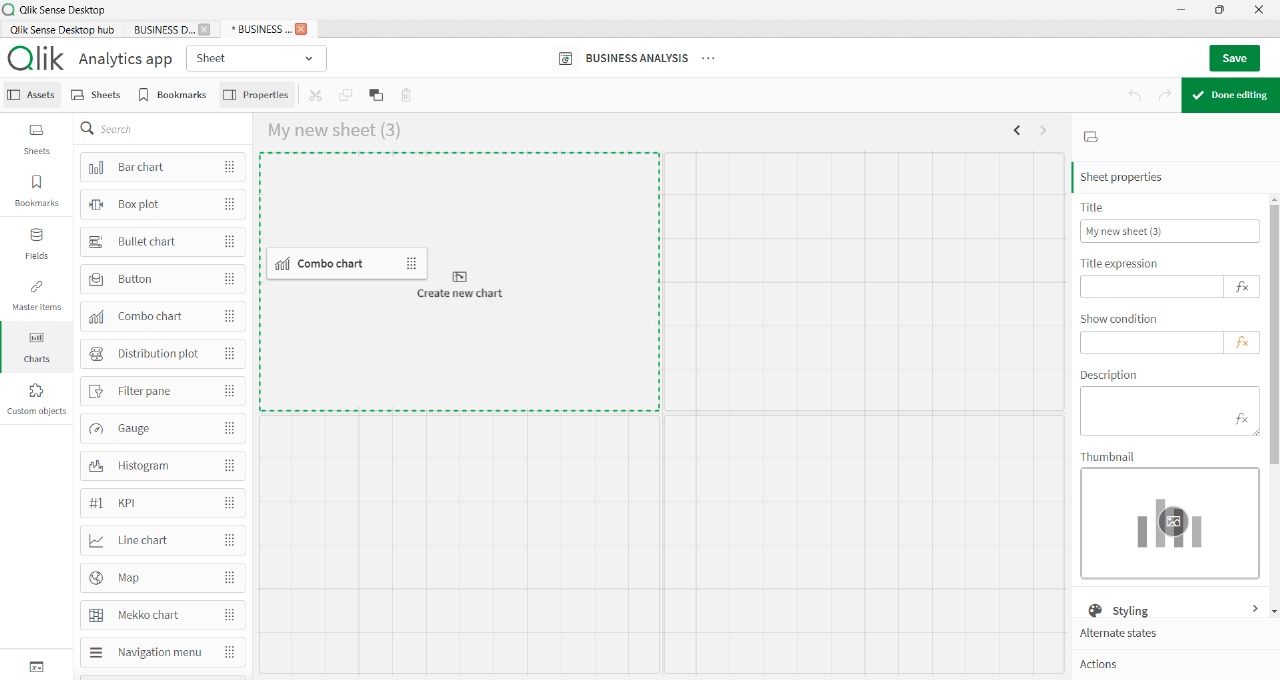
- Drag and Drop the Chart type in Sheet.
- Add all the dimensions required.
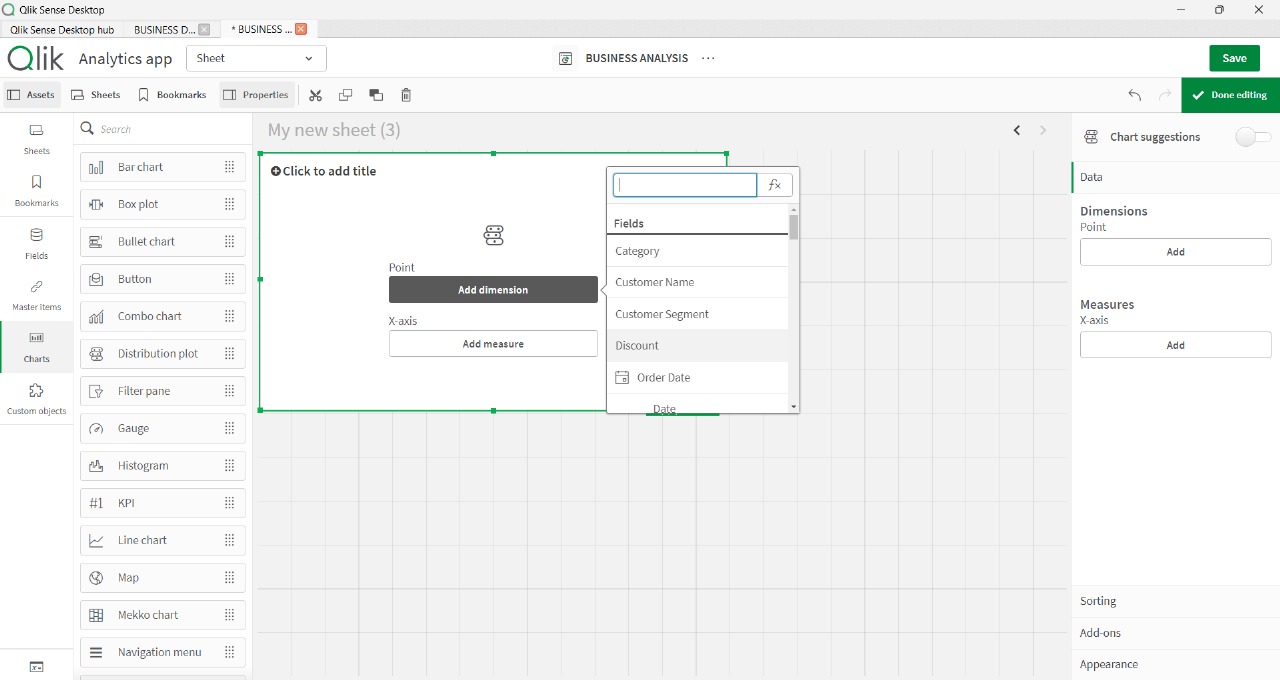
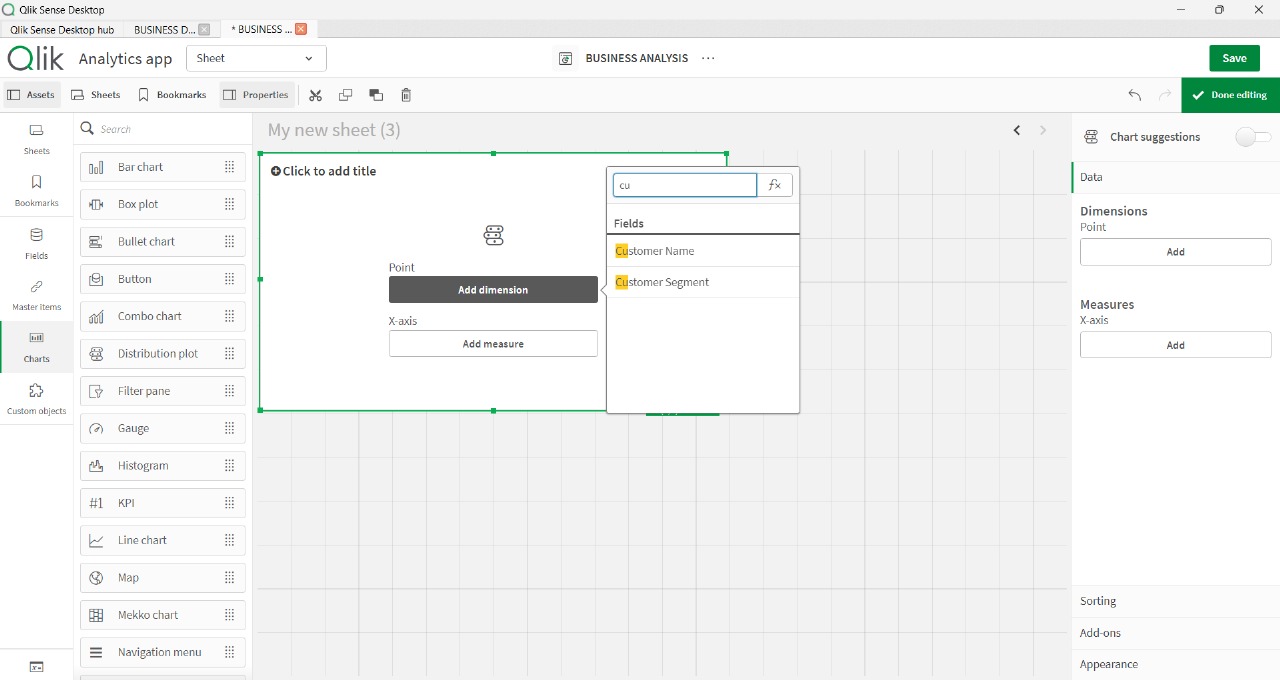
- Search for the fields.
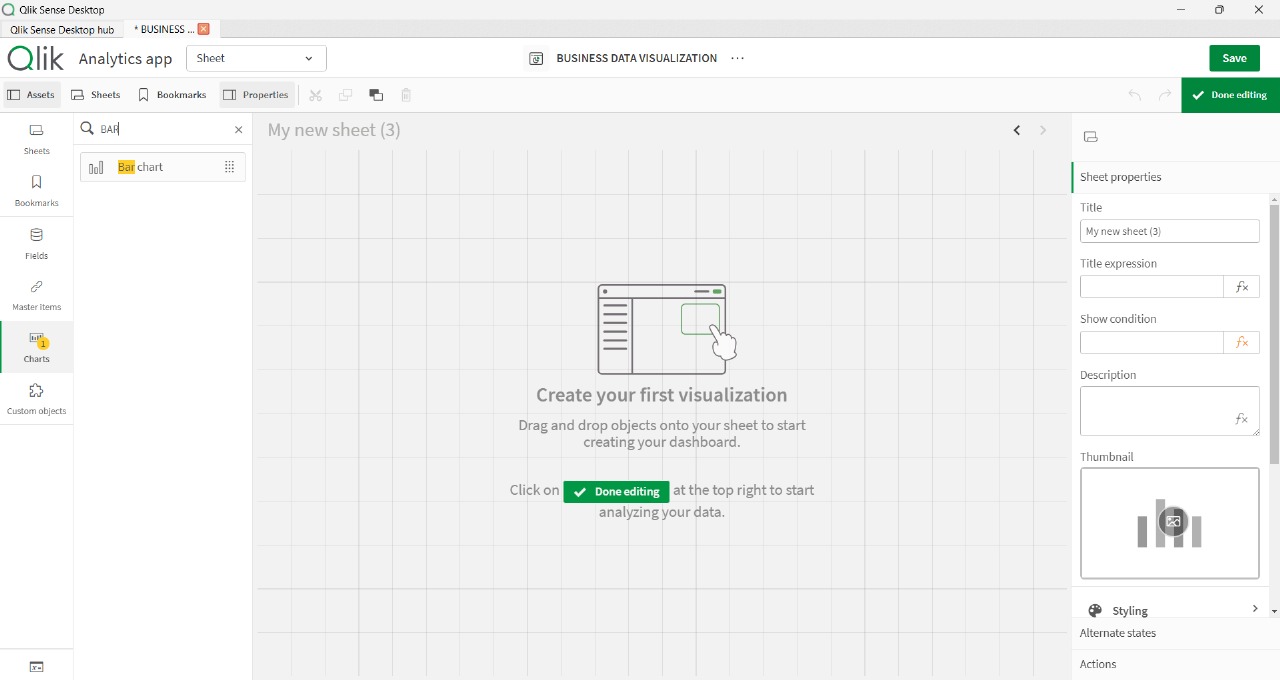
- Search for the charts created and drag and drop them in the work area.
- You can download the Sheets as well after finishing in the form of PDF.

Use Cases
This software finds great usage in the following scenarios:-
- Sales & Revenue Analysis
- Customer Segmentation & Behavior Analysis
- Financial & Risk Management
- Supply Chain & Inventory Management
- Healthcare & Patient Data Analytics
Conclusion
Qlik Sense is a powerful BI tool that makes data analysis intuitive and decision making easy using an intuitive interface and AI powered insights. It enables users of all types in businesses to turn raw data into visuals which is simpler to understand and is more actionable. It has both ease-of-use and advanced features and is a good choice for people seeking deeper insights inside their data.